 blackMORE Ops Learn one trick a day ….
When it comes to keeping tabs on your Linux system’s performance, choosing the right monitoring tool can make all the difference between efficient troubleshooting and frustrating guesswork. From the classic ‘top’ command to more sophisticated alternatives like Atop, Btop, and Htop, Linux offers a range of options to suit different monitoring needs.
System administrators and power users alike need reliable tools to track resource usage, identify bottlenecks, and maintain optimal system performance. While these monitoring utilities share similar core functions, their approaches to presenting information, handling historical data, and user interaction vary significantly.
In this comprehensive guide, we’ll explore the strengths and weaknesses of top, atop, btop, and htop to help you determine which tool deserves a place in your Linux administration arsenal.
Quick Comparison Table
| Feature | Top | Atop | Btop | Htop |
|---|---|---|---|---|
| Focus | Basic monitoring | Historical data logging | Modern UI with visual flair | Balanced functionality |
| UI Complexity | Minimal | Technical | Minimalistic | Moderate |
| Historical Data | None | Excellent | Limited | None |
| Resource Usage | Extremely low | Very low | Low | Low |
| Customisation | Limited | Moderate | Good | Excellent |
| Mouse Support | None | Limited | Full | Full |
| Process Management | Very basic | Basic | Good | Excellent |
| Learning Curve | Low | Steep | Gentle | Moderate |
The Evolution of Linux Monitoring Tools
Top: The Original Workhorse
The venerable ‘top’ command has been the foundation of Linux system monitoring for decades. As the oldest and most basic option in our comparison, top represents the starting point from which all other monitoring tools have evolved.
Key Features:
- Simple process monitoring displaying basic CPU and memory usage
- Sortable process list allowing organisation by various metrics
- Minimal resource overhead using almost no system resources itself
- Universal availability pre-installed on virtually all Linux distributions
- Basic process manipulation capabilities for sending signals
Advantages:
- Available on any Linux system without additional installation
- Extremely lightweight with negligible impact on system resources
- Familiar to almost all Linux administrators
- Reliable with decades of testing and refinement
Limitations:
- Basic interface with limited visual information
- No mouse support or modern navigation features
- Minimal customisation options
- No historical data retention
Best Use Case: Quick system checks on any Linux machine, particularly when working on unfamiliar systems where other tools may not be installed.
Atop: The Historical Data Champion
Atop elevates system monitoring by focusing on historical data retention and comprehensive resource tracking. It stands out as the go-to tool for system administrators who need to examine performance metrics over time.
Key Features:
- Comprehensive resource monitoring with detailed metrics on CPU, memory, disk, and network usage
- Historical data logging and analysis allowing review of system performance from hours or days ago
- Minimal system impact ensuring accurate monitoring without significant resource consumption
- Advanced per-process statistics including granular resource usage tracking
- Automatic data logging capabilities that operate in the background
Advantages:
- Unmatched for troubleshooting intermittent performance issues
- Excellent for long-term system analysis and pattern identification
- Superior disk I/O and network monitoring detail
- Capable of identifying resource-intensive processes over extended periods
Limitations:
- Technical interface with steep learning curve
- Less intuitive navigation compared to modern alternatives
- Limited interactive capabilities and visual representations
Pro Tip: Use Atop when investigating system issues that occur sporadically or when you need to analyse resource usage trends over time.
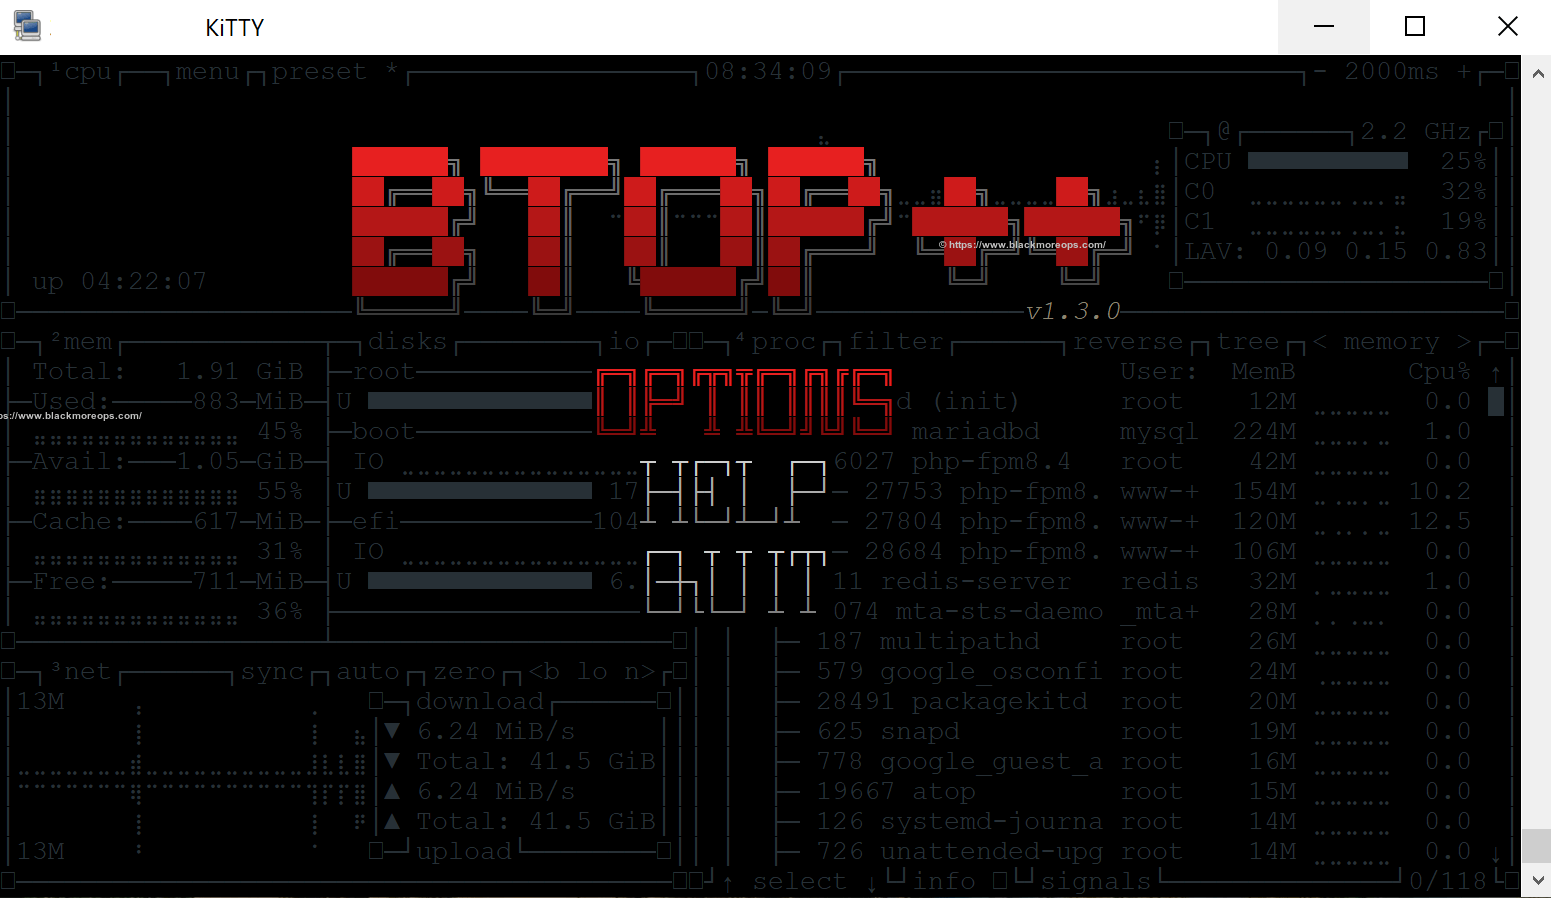
Btop: The Modern Visual Champion
Btop represents the newest evolution in terminal-based system monitoring, combining comprehensive data with striking visual presentation. Its modern approach makes system information both accessible and aesthetically pleasing.
Standout Capabilities:
- Beautiful, intuitive interface with thoughtful information organisation
- Full mouse interaction support for intuitive navigation
- Real-time visualisations including graphs, charts, and heat maps
- Comprehensive system overview combining CPU, memory, network, and disk in one view
- Rich theme ecosystem including the popular Everforest theme
Advantages:
- Most visually refined interface of all monitoring tools
- Excellent balance of information density and readability
- Accessible to both beginners and experienced administrators
- Growing community support with active development
Limitations:
- Slightly higher resource usage than traditional tools
- Less historical data capability than Atop
- As a newer tool, less extensively documented
Best For: Users who value visual clarity and modern design alongside powerful monitoring capabilities.
Htop: The Versatile All-rounder
Htop bridges the gap between traditional and modern approaches, enhancing the functionality of top while maintaining a familiar feel. It has become the default choice for many system administrators seeking reliable, interactive monitoring.
Notable Features:
- Colour-coded process view for intuitive system state assessment
- Tree view for process relationships displaying parent-child hierarchies
- Extensive keyboard shortcuts for efficient operation
- Robust process management with comprehensive signal options
- Horizontal and vertical scrolling to access complete process information
Advantages:
- Excellent balance of functionality and usability
- Superior process management capabilities
- Well-established with extensive documentation
- Highly configurable to suit individual preferences
Limitations:
- No built-in historical data capabilities
- Less visually sophisticated than Btop
- Requires more system resources than the original top
Why Choose Htop: Perfect for users who want enhanced monitoring capabilities with proven reliability and minimal learning curve.
Side-by-Side Feature Breakdown
1. User Interface Design
- Top: Spartan, text-only interface with minimal visual organization. Displays a summary header and process list without graphical elements or color coding. The interface prioritizes information density over user experience.
- Atop: Technical, data-dense interface with tabular presentation. Uses basic color highlighting for critical values but maintains a focus on comprehensive data presentation rather than visual appeal. Multiple specialized views can be toggled for different subsystems.
- Btop: Modern, aesthetically pleasing design with thoughtful information hierarchy. Features elegant graphs, charts, and visual meters with smooth animations. Supports beautiful themes like Everforest that transform the monitoring experience into something genuinely enjoyable.
- Htop: Functional interface with practical color coding and improved organization. Builds upon top’s familiar layout while adding visual clarity and better information grouping. Offers good readability without sacrificing technical detail.
2. Historical Data Capabilities
- Top: No historical data capabilities. Provides only a real-time snapshot of current system state with no built-in way to track changes over time or review past performance.
- Atop: Industry-leading historical data retention. Automatically logs comprehensive system metrics that can be reviewed and analyzed hours, days, or even weeks later. Includes detailed historical tracking of processes, disk I/O, network, memory, and CPU usage.
- Btop: Limited historical context within the current session. Displays short-term trends via graphs but lacks persistent logging or the ability to review data from previous monitoring sessions.
- Htop: No built-in historical data functionality. Focuses exclusively on real-time monitoring without tracking metrics over time.
3. Process Management Capabilities
- Top: Basic process control with limited interaction. Allows sending signals to processes but with cumbersome keyboard commands and minimal filtering options.
- Atop: Moderate process management focused on monitoring rather than control. Provides comprehensive process information with basic interactive capabilities for process manipulation.
- Btop: Good process management with intuitive controls. Features mouse-based interaction for sending signals, adjusting priorities, and filtering the process list in a user-friendly manner.
- Htop: Excellent process management toolkit. Offers comprehensive options for filtering, sorting, signaling, and managing processes with efficient keyboard shortcuts and mouse support.
4. Resource Monitoring Depth
- Top: Basic monitoring of essential metrics. Shows CPU, memory, and process information with limited detail and no subsystem-specific views.
- Atop: Comprehensive, detailed monitoring across all subsystems. Provides exceptionally granular data about CPU, memory, disk I/O, network, and process activity with specialized views for each subsystem.
- Btop: Good all-around monitoring with visual context. Displays CPU, memory, network, and disk information in an integrated view with graphical representations that make patterns immediately apparent.
- Htop: Solid monitoring focused on CPU and memory. Strong emphasis on process-related metrics with good detail but less comprehensive coverage of disk and network subsystems.
5. Customisation and Flexibility
- Top: Minimal customisation with basic command-line options. Limited to sorting choices and update intervals with no persistent configuration.
- Atop: Moderate customisation focused on data presentation. Offers configurable views and thresholds but with limited aesthetic or layout adjustments.
- Btop: Good customisation with excellent theme support. Features configurable layouts, display options, and a growing ecosystem of community themes, including the stunning Everforest theme that transforms the monitoring experience.
- Htop: Extensive customisation capabilities. Provides detailed control over column selection, color schemes, meters, and layout with persistent configuration options.
The Right Tool for Your Monitoring Needs
When to Use Top
- You’re working on an unfamiliar system without administrative access
- You need an absolutely minimal resource footprint
- You require universal compatibility across all Linux distributions
- You’re performing very basic system checks that don’t require detailed analysis
- You’re writing scripts that need to parse simple system information
When to Use Atop
- You need to investigate intermittent performance issues that occur unpredictably
- Historical performance analysis is essential to your troubleshooting workflow
- You require detailed disk I/O statistics for storage performance optimization
- You need to correlate system events across different subsystems over time
- You’re monitoring production servers where resource efficiency is critical
When to Use Btop (Our Recommendation)
- You want a visually intuitive monitoring experience with modern design
- You appreciate the importance of information design in system management
- You desire a balance of powerful features and aesthetic presentation
- You’d benefit from comprehensive system information in a unified view
- You enjoy customizing your tools with themes like the beautiful Everforest theme
When to Use Htop
- You need robust process management capabilities
- You want a familiar top-like interface with significant enhancements
- You require stable, well-tested software with extensive documentation
- Process relationship visualization is important in your workflow
- You prefer keyboard-driven operation with extensive shortcuts
Enhancing Btop with the Everforest Theme
One of the standout features of btop is its exceptional theme support. The Everforest theme transforms btop into not just a functional monitoring tool but a genuinely beautiful interface that’s a pleasure to use during long troubleshooting sessions.
Installing Everforest Theme for Btop
# Create themes directory if it doesn't exist
mkdir -p ~/.config/btop/themes

# Download the Everforest theme
curl -o ~/.config/btop/themes/everforest-dark-hard.theme https://raw.githubusercontent.com/iambeingtracked/btop-everforest/main/everforest-dark-hard.theme

# Launch btop
btop
Once btop is running:
- Press “Escape” to access the menu
- Navigate to “Options”
- Select “everforest-dark-hard” from the theme dropdown
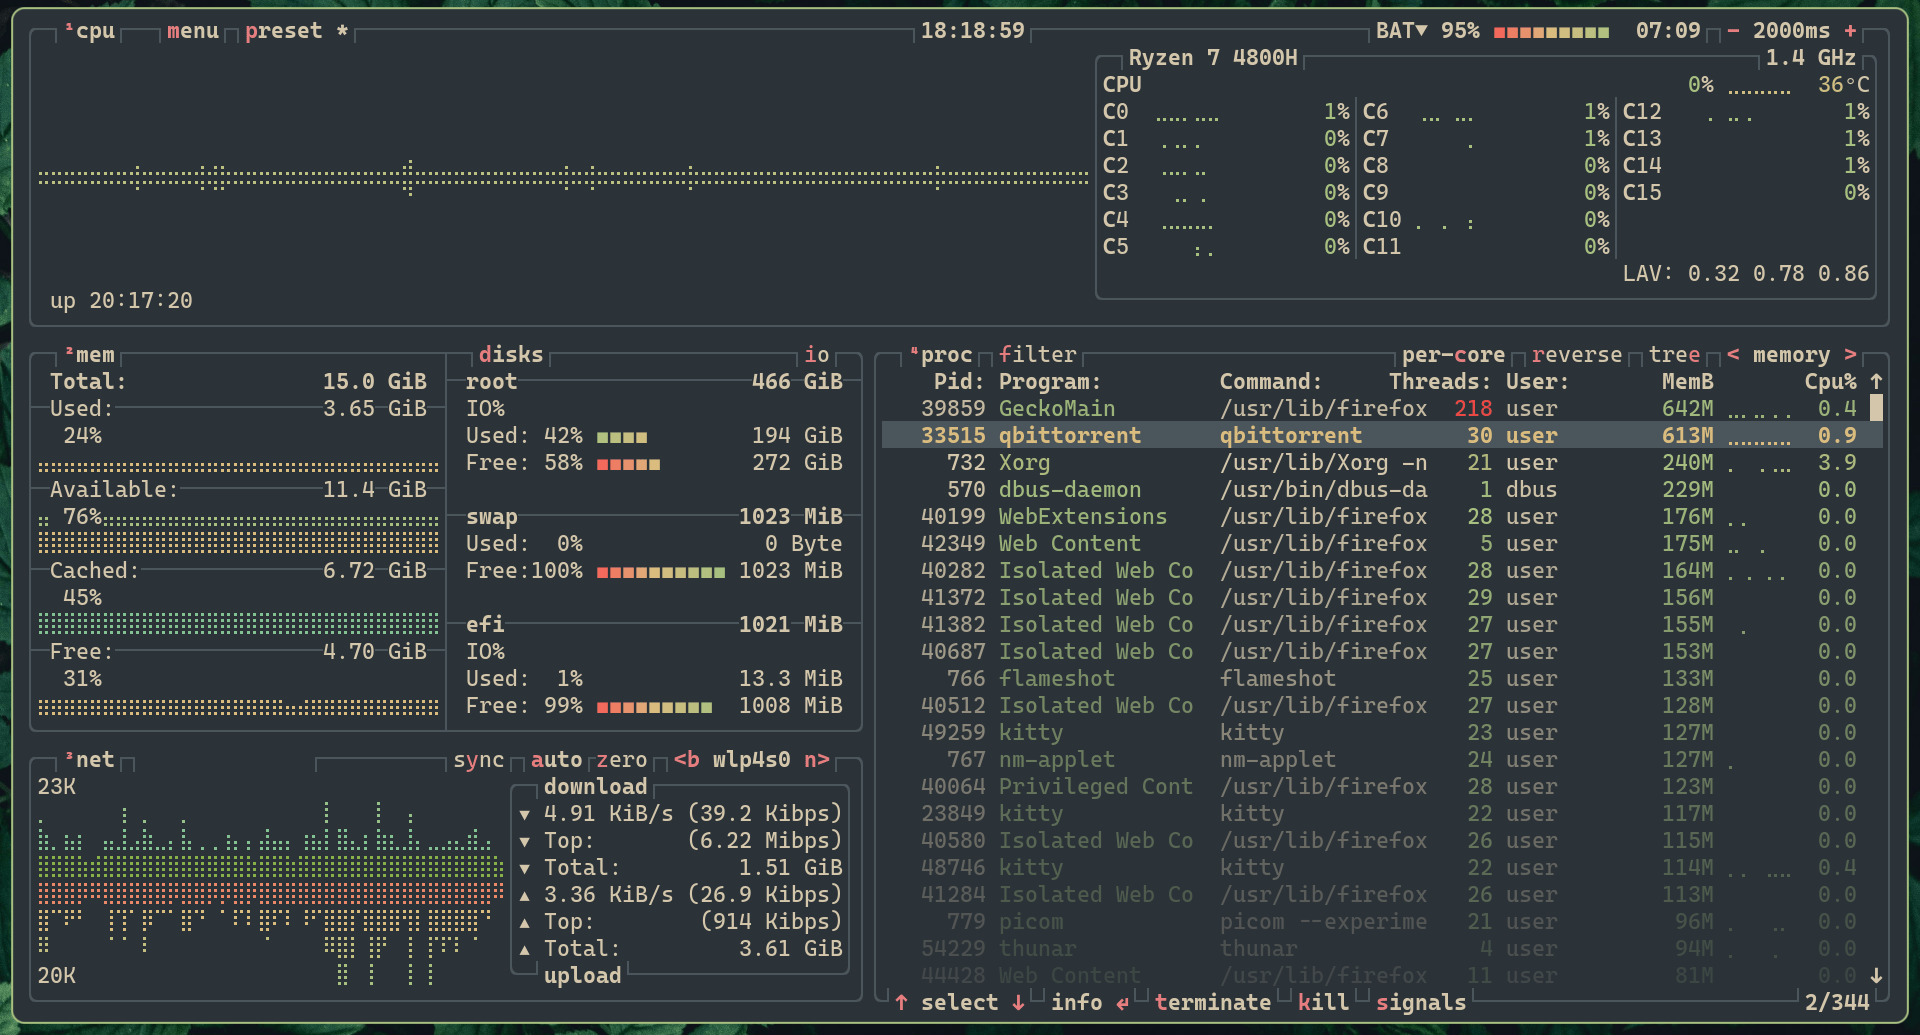
The Everforest theme features a soothing dark color palette that reduces eye strain while maintaining excellent contrast for readability. Its harmonious green and earth tones create a monitoring environment that’s both functional and visually refreshing.
Practical Usage Scenarios
To better illustrate when each tool shines, let’s examine some common system administration scenarios:
Daily System Health Checks
For routine system health monitoring, btop provides the most user-friendly experience. Its comprehensive dashboard layout gives you immediate visual feedback on all critical system metrics. The clear CPU, memory, network, and disk visualizations help identify potential issues at a glance, while the Everforest theme makes extended monitoring sessions comfortable.
Performance Troubleshooting
When investigating performance issues, particularly those that occur intermittently, atop is unrivaled. Its historical logging capabilities allow you to capture system metrics during off-hours and analyze them later. This is invaluable for tracking down issues that don’t manifest while you’re actively monitoring the system.
Resource-Constrained Environments
In extremely resource-limited systems or emergency situations, the original top command remains valuable. Its minimal footprint ensures it won’t compound resource issues on an already struggling system, and its universal availability means you’ll never be without basic monitoring capabilities.
Process Management
For administrators who frequently need to manage, kill, or reprioritize processes, htop offers the most comprehensive toolkit. Its intuitive process tree view, efficient keyboard shortcuts, and robust signaling capabilities make it the go-to choice for hands-on process management.
Conclusion: The Evolution of System Monitoring
The journey from top to the modern monitoring tools we have today represents an evolution in how we interact with and understand our Linux systems. While the venerable top command laid the foundation, atop, btop, and htop have each pushed the boundaries of what system monitoring can offer.
For most users, particularly those who value both functionality and aesthetics, btop represents the pinnacle of this evolution—especially when enhanced with the Everforest theme. Its beautiful interface doesn’t just make system monitoring more pleasant; it makes critical information more accessible and patterns more immediately apparent.
However, each tool in this comparison has earned its place in the Linux administrator’s toolkit. The original top continues to provide universal compatibility, atop offers unmatched historical analysis, and htop delivers robust process management with a familiar feel.
The best approach may be to become familiar with all four tools, using each one when its particular strengths align with your current needs. By mastering this suite of monitoring utilities, you’ll be well-equipped to handle any system performance challenge that comes your way.


